Analytics and attribution for an open source project a.k.a story of how we tracked an unexpected burst of traffic

TL;DR: We had a spike of traffic Monday (May 6th) morning, and we looked at our metrics to find out we got featured in a french newsletter and a viral tweet
Monday Morning: Random burst of traffic
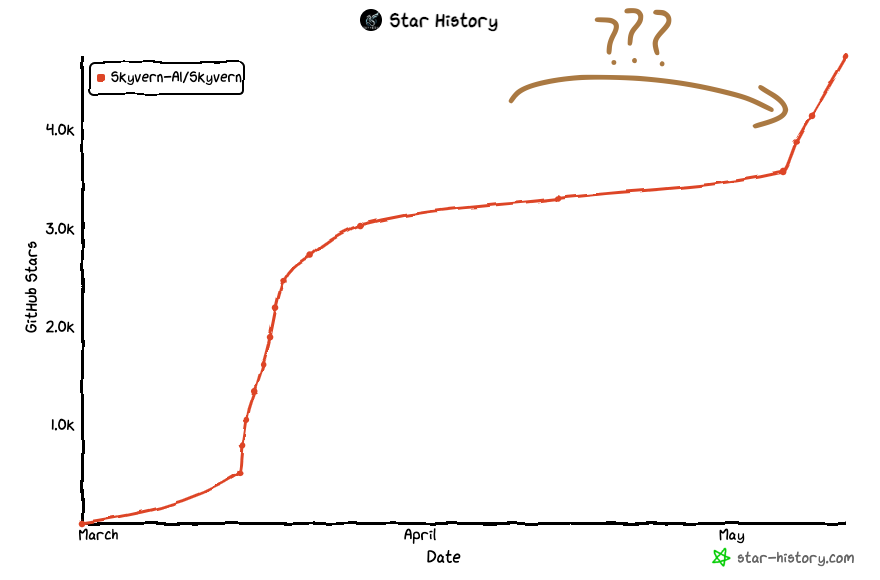
Last Monday morning (May 6th), we woke up to a large burst of traffic to skyvern.com, an influx of Github stars (+1200) in our open source repo, and a burst of new users in our discord (+70) — which led us to scratch our heads.. where did this traffic come from? We hadn’t done any launches, no publicity, nothing.

Fortunately, we were cautious founders and had set up some analytics ahead of our first launch. It was time to roll up the sleeves and see how much information we can glean from these sources.
Investigating the traffic
Ahead of our initial Hackernews launch, we had set up two major pieces of analytics:
- Landing page attribution (via PostHog)
- Open source installation and usage metrics (via PostHog)
This gave us a place to get started: we can look at this information to see what the source of this new traffic was
Looking at landing page traffic
We pulled up our Posthog Landing pages dashboard and navigated to the “Referring Domains” report and something new immediately stood out: what’s korben.info?
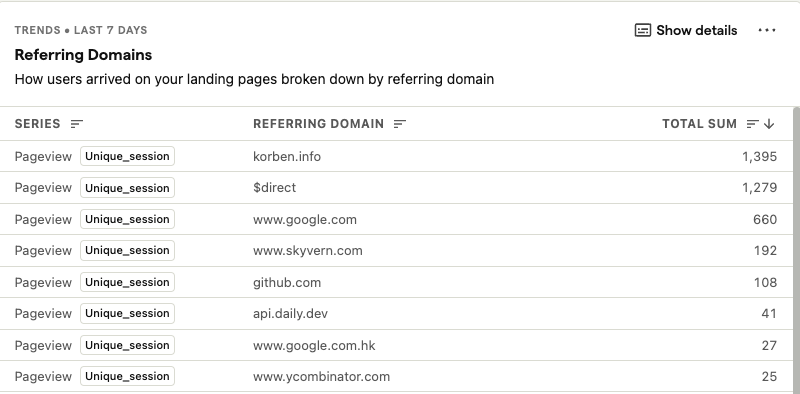
A quick google search for korben.info immediately reveals the source of information: https://korben.info/skyvern-automatisation-web-ia-vision-ordinateur.html

Amazing! We’ve gotten to the bottom of it. All of our traffic came from korben.info.. right? How can we be sure?
Looking at Github traffic reports
To our surprise, Github also offers metrics for repo owners. They offer interesting metrics like:
- Git clones (ie number of unique users that have cloned Skyvern)
- Visitors (unique visitors to the github repo)
- Popular content (which files in the repo are the most popular?)
- Referring sites (sources of the traffic)
Looking a bit deeper into the Referring sites metric, we had one source stand out: t.co
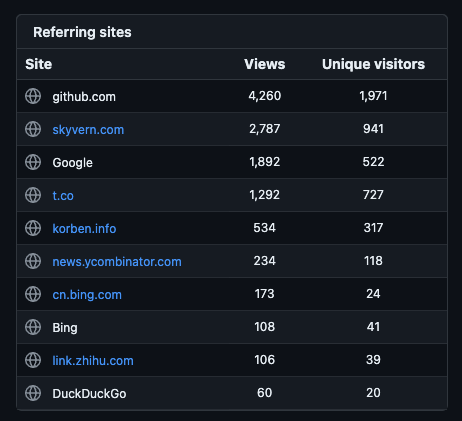
We had a large spike of users coming from Twitter? What tweet could be the source of all this traffic? A quick search for Skyvern revealed the source: https://twitter.com/tuturetom/status/1787296091475780054

Finally, mystery solved!
We got to the bottom of this burst of traffic! Two sources (korbin.info & tweet from @tuturetom) featuring Skyvern both at the same time — how exciting!
But.. this is a good opportunity to do an audit of the data we collect about our visitors to help us (1) understand which direction we should double down on in our business, and (2) what friction our potential customers are experiencing as they go sample Skyvern
What other data do we collect?
We use PostHog as our product analytics platform, tracking the two surfaces random people on the internet have to learn about our product:
Landing Page Analytics
PostHog (unlike GA-4) comes pre-packed with a lot of useful data collection about website visitors. It features metrics such as:
- Unique sessions on our landing page (over time)
- Average session duration
- Most popular destinations on our website
- Referring domains (where did this user come from?)
- Pages per session (How many pages do people visit before leaving the website)
- New & Returning users
- User breakdown by country, browser, device
Not much to say here — our landing page is very very simple, so the pre-packaged metrics are good enough. We will likely publish a blog-post after we revamp our landing page, expanding some of these metrics and diving into user segments to figure out how subpages and detailed use-case descriptions on our landing page impact our conversion rate.
Open Source Analytics
We set up custom analytics to track the following in our open source repository:
- Setup script completed — Track how many people set Skyvern up
- Server and UI “runs” — Track how many people are running Skyvern (post-setup)
- Tasks Created + Completed + Failed (unique and non-unique users)
- Our users create tasks to instruct Skyvern to execute something in the browser. This is the most important metric to capture open source usage, and we keep track of how many tasks get created, how many fail, and how many are successful
Things we don’t track but we definitely should
We currently don’t track when exceptions / stack traces happen when someone is running Skyvern:
- Windows users have reported issues running Skyvern with Poetry. We would have been able to identify this sooner had we built exception tracking.
- Foreign users have seen issues running Skyvern if there is an issue with Posthog (ie if it’s blocked for some reason)
Things we don’t track on purpose
- We don’t track users’ emails or PII without their consent. We have access to their email if they agree to share it with us, but we felt it was an invasion of privacy to grab it without their consent
- Non-metadata task information such as instruction and task payloads. Skyvern users call Skyvern with a url, an instruction, and a payload. The payload contains information required for Skyvern to execute a task. Since payload and the instruction may contain sensitive information such as PII we only collect the URL and nothing else. This is a conscious decision that we made to preserve the privacy of our open source users.